PLOT
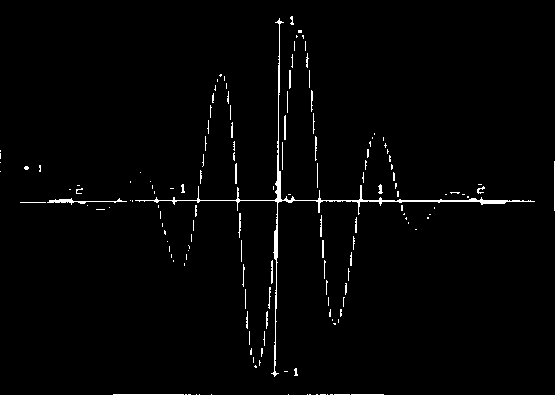
A versatile graph-plotting package for use in research, accounting, schools, and mathematics, or simply for amusement. Will draw a graph of a specified function, with automatic scaling if required, or a plot of coordinate data, connected by line segments or a smooth curve; a regression line can be fitted to data. Annotated axes are drawn if required. Program 5K, graphics 6K.
SIMULTANEOUS
Solves a set of simultaneous equations, with integer or real coefficients, by the rapid Gaussian- elimination technique. Program 2K, graphics ½K.
REGRESSION
Calculates the best-fitting straight line to a specified set of data points, gives the equation of the line, and the correlation coefficient of the fit. Program 2K, graphics ½K.